kube-prometheus 是一整套监控解决方案,它使用 Prometheus 采集集群指标,Grafana 做展示,包含如下组件:
- The Prometheus Operator
- Highly available Prometheus
- Highly available Alertmanager
- Prometheus node-exporter
- Prometheus Adapter for Kubernetes Metrics APIs(k8s-prometheus-adapter)
- kube-state-metrics
- Grafana
其中 k8s-prometheus-adapter 使用 Prometheus 实现了 metrics.k8s.io 和 custom.metrics.k8s.io API,所以不需要再部署 metrics-server。如果要单独部署 metrics-server,请参考:附录D:部署 metrics-server 插件
如果没有特殊指明,本节课的所有操作均在 k8s-01 节点上执行。
在没有安装 Metrics 组件之前,使用 kubectl top pods 命令,查看不了监控数据,安装之后,便可以使用 kubectl top pods 查看 Pod 的性能指标。安装 Metrics 之前:
$ kubectl top pods
error: Metrics API not available
下载和安装 Prometheus#
cd /opt/k8s/work
git clone -b v0.14.0 https://github.com/coreos/kube-prometheus.git
cd kube-prometheus/
kubectl apply --server-side -f manifests/setup
kubectl wait \
    --for condition=Established \
    --all CustomResourceDefinition \
    --namespace=monitoring
kubectl apply -f manifests/
查看运行状态#
$ kubectl -n monitoring get pods
NAME                                   READY   STATUS    RESTARTS   AGE
alertmanager-main-0                    2/2     Running   0          61m
alertmanager-main-1                    2/2     Running   0          61m
alertmanager-main-2                    2/2     Running   0          61m
blackbox-exporter-86745676c9-8npl7     3/3     Running   0          61m
grafana-599bb4cc9d-9gsnl               1/1     Running   0          61m
kube-state-metrics-6f46974967-brcl8    3/3     Running   0          61m
node-exporter-5ng76                    2/2     Running   0          61m
node-exporter-n9x5x                    2/2     Running   0          61m
prometheus-adapter-784f566c54-mzdfw    1/1     Running   0          61m
prometheus-adapter-784f566c54-n9psh    1/1     Running   0          61m
prometheus-k8s-0                       2/2     Running   0          61m
prometheus-k8s-1                       2/2     Running   0          61m
prometheus-operator-57b579d5b9-r25xf   2/2     Running   0          61m
测试 kubectl top 命令是否能够获取 Pod 的运行指标:
$ kubectl top pods -n monitoring
NAME                                   CPU(cores)   MEMORY(bytes)
alertmanager-main-0                    1m           35Mi
alertmanager-main-1                    1m           34Mi
alertmanager-main-2                    3m           33Mi
...
访问 Prometheus UI#
启动服务代理:
$ kubectl port-forward --address 0.0.0.0 pod/prometheus-k8s-0 -n monitoring 9090:9090
Forwarding from 0.0.0.0:9090 -> 9090
- port-forward 依赖 socat。
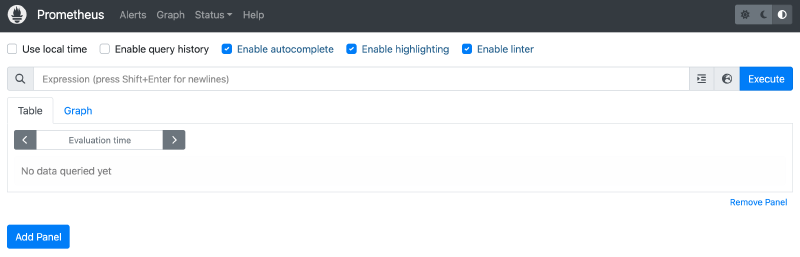
浏览器访问:http://10.37.91.93:9090/。访问界面如下:
访问 Grafana UI#
启动代理:
$ kubectl port-forward --address 0.0.0.0 svc/grafana -n monitoring 3000:3000
Forwarding from 0.0.0.0:3000 -> 3000
浏览器访问:http://10.37.91.93:3000/。访问界面如下:
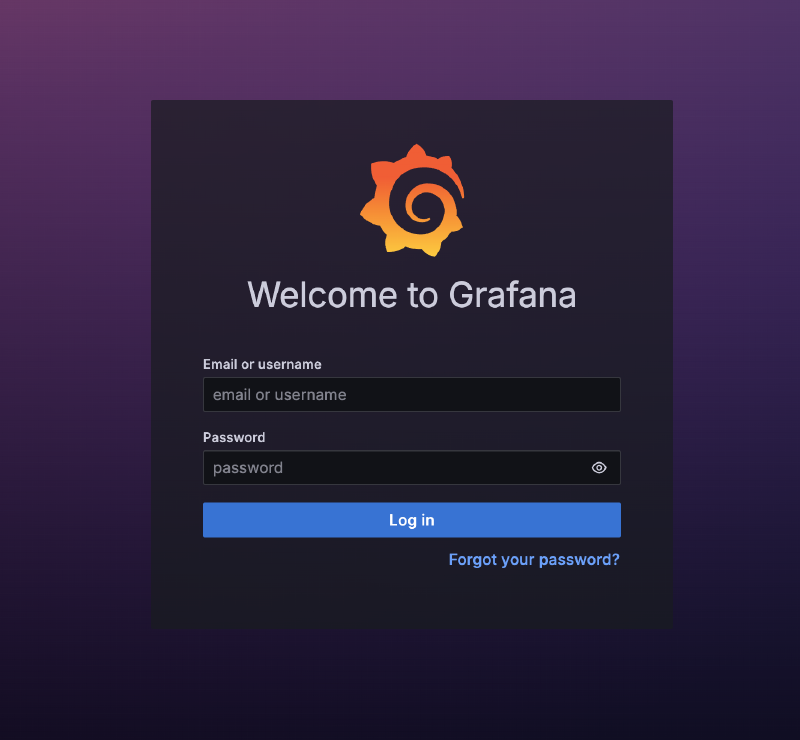
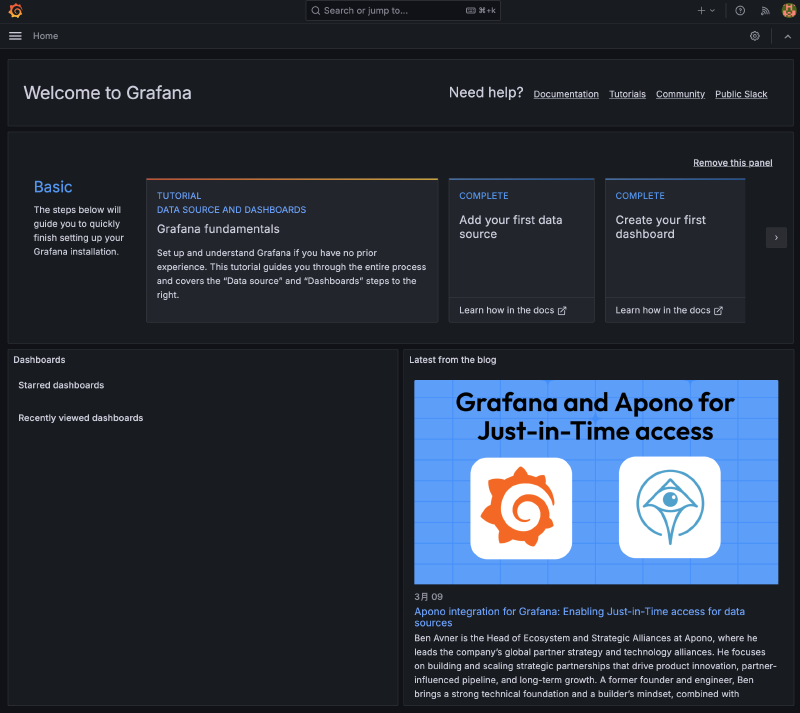
用 admin/admin 登陆。然后,就可以看到各种预定义的 dashboard 了,界面如下: